The one number - CO₂ in the atmosphere
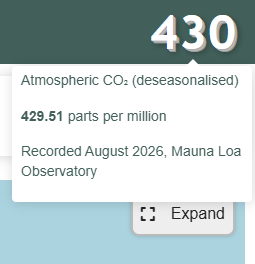
In the top-right corner of every page on ClimateExplorer there's a number. It isn't a visitor count or a version number: it's the amount of carbon dioxide (CO₂) in Earth's atmosphere. It's measured in parts per million (ppm), at the Mauna Loa Observatory in Hawaii. Hover over it for the details, and click it to open the recent CO₂ observations panel.
When hit by infrared light, the carbon dioxide molecule vibrates and heats the atmosphere. As we put more CO₂ into the atmosphere, the planet becomes hotter. CO₂ is the main cause of recent global heating.
Where the idea came from
On 1 November 2021, David Attenborough addressed world leaders at the opening of COP26, the United Nations climate conference in Glasgow. Attenborough began:
It's easy to forget that ultimately the climate emergency comes down to a single number — the concentration of carbon in our atmosphere.
He went on to say that for much of humanity's history, that number bounced between 180 and 300 parts per million. As he spoke, the screen behind him showed where it stood that day: 414.
(A full transcript of the speech is available from the ABC.)
The CO₂ concentration is the one number that sums up our predicament.
417, 429, 430
The number we show is deseasonalised. Around the time of Attenborough's address, the deseasonalised figure was about 417 ppm. When the number was added to the site in July 2026, it read 429. In August 2026 it ticked over to 430 (the latest value, 429.51, rounds up to 430).
That's an increase of about 2.6 ppm per year since Attenborough stood up in Glasgow and asked the world to act. If we did not burn fossil fuels, the number would stay steady from year to year.
What "deseasonalised" means
If you look at the raw monthly CO₂ measurements from Mauna Loa, they don't rise smoothly. They go up and down every year like a sawtooth. The cause is the plant life of the Northern Hemisphere, which holds most of the planet's land and forests. Each spring and summer, plants draw CO₂ out of the air as they grow, and the concentration falls. Each autumn and winter, leaves drop and decay, releasing CO₂ again, and the concentration rises. At Mauna Loa the peak comes around May and the low point around September/October, a swing of about 6 ppm each year.
That seasonal swing gets in the way when we want to study a much stronger signal: humans burning fossil fuels (coal, oil, and gas). The 2026 figures show the problem:
| Month (2026) | Monthly average | Deseasonalised |
|---|---|---|
| May | 432.34 | 429.06 |
| June | 431.43 | 428.99 |
| July | 429.13 | 428.78 |
| August | 427.55 | 429.51 |
Going by the raw monthly average, CO₂ fell by nearly 5 ppm between May and August. However, during this period (the Northern Hemisphere summer), plants were drawing CO₂ out of the atmosphere and into new growth as part of the annual cycle of life. The deseasonalised column removes that yearly cycle and leaves the underlying level.
This is also why Attenborough's screen said 414 while we quote 417 for 2021. The monthly average for October 2021 (near the seasonal low point) was 413.90 ppm. The deseasonalised value for that month was 417.14 ppm.
How it's calculated
The numbers come from NOAA's Global Monitoring Laboratory, which publishes the Mauna Loa monthly mean data with a "monthly average" column and a "de-seasonalized" column side by side. The NOAA Trends in CO₂ page describes a de-seasonalised method for their chart:
The red lines and symbols represent the monthly mean values, centered on the middle of each month. The black lines and symbols represent the same, after correction for the average seasonal cycle. The latter is determined as a moving average of SEVEN adjacent seasonal cycles centered on the month to be corrected, except for the first and last THREE and one-half years of the record, where the seasonal cycle has been averaged over the first and last SEVEN years, respectively.
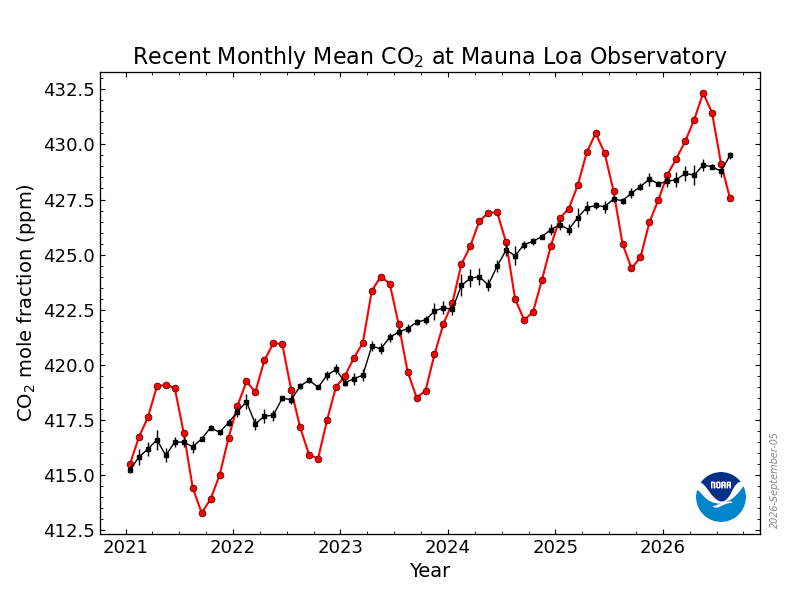
A de-seasonalisation process
NOAA doesn't publish the arithmetic behind the statements, but the standard way to do it has four steps. Here they are for one month, August 2019, when the measured monthly average was 410.17 ppm.
Step 1: average a full year around the month. Take the twelve months centred on August 2019 (February 2019 to February 2020, with the two end months counted at half weight so the window is balanced) and average them. Any twelve-month window contains exactly one seasonal peak and one seasonal trough, so they cancel out and the average has no seasonal swing in it. The result is 411.96 ppm.
Step 2: compare the month to that average. August 2019 measured 410.17, which is 1.79 ppm below its twelve-month average. That gap is the seasonal effect for August of that year.
Step 3: repeat for seven Augusts and average the gaps. One year's gap is noisy, since it includes that year's weather as well as the regular cycle. So do the same thing for the three Augusts before and the three after:
| August | Monthly average | Twelve-month average | Gap |
|---|---|---|---|
| 2016 | 402.45 | 404.82 | −2.37 |
| 2017 | 405.32 | 406.99 | −1.67 |
| 2018 | 407.16 | 409.10 | −1.94 |
| 2019 | 410.17 | 411.96 | −1.79 |
| 2020 | 412.75 | 414.47 | −1.72 |
| 2021 | 414.42 | 416.74 | −2.32 |
| 2022 | 417.15 | 418.69 | −1.54 |
The average of the seven gaps is −1.91 ppm. That is the typical August effect for this period: August usually sits 1.91 ppm below the level of the year around it.
Step 4: remove it. Take the measured value and subtract the typical August effect: 410.17 − (−1.91) = 412.08 ppm. NOAA's published deseasonalised value for August 2019 is 412.10.
The small difference is because NOAA's exact procedure isn't identical to this one. Running these steps over the whole Mauna Loa record reproduces NOAA's deseasonalised column to within about 0.06 ppm on average.
The seasonal cycle for the most recent months can't be centred (the future years don't exist yet), so NOAA uses the last seven years instead. As new data arrives, the most recent deseasonalised values can shift by a small amount.
The deseasonalised value is still a single month's measurement, not a long-term average. It keeps the month-to-month noise, but removes the predictable annual swing.
Mauna Loa Observatory
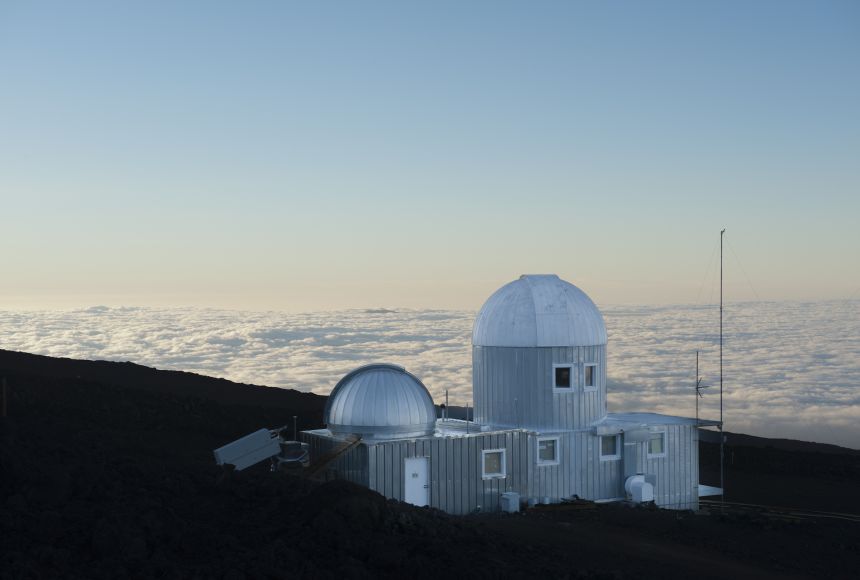
Photograph by Jonathan Kingston / National Geographic, from National Geographic Education.
The Mauna Loa Observatory sits about 3,400 metres up the side of the Mauna Loa volcano on Hawaii's Big Island, far from major sources of pollution, in some of the cleanest air on Earth. Charles Keeling began measuring CO₂ there in 1958, and the site now holds the longest continuous direct record of atmospheric CO₂ in the world. From it, Keeling created the Keeling Curve.
NOAA notes that because Mauna Loa is a single high-altitude site in the northern subtropics, its values may not be exactly the same as the global average CO₂ concentration at the surface. They're very close, though, and Mauna Loa's long, unbroken record is what makes it the reference.
Interruptions
That record almost broke. In November 2022, Mauna Loa erupted and lava buried the observatory's access road and power lines. Within ten days NOAA staff had set up temporary CO₂ measurements at nearby Maunakea, and the record carried on. (The NOAA data file notes that observations from December 2022 to July 2023 came from Maunakea.)
In March 2025, the US government listed the lease on NOAA's Hilo office for cancellation. Forbes wrote:
As part of a broad cost-cutting drive, the Trump administration moved to cancel the lease on the federal office behind NOAA's Mauna Loa Observatory in Hawaii, home of the Keeling Curve and one of the most consequential scientific records humanity has ever produced. This spring [2026], NOAA announced the opposite: the same site was being reopened, rebuilt and expanded.
A temporary road through the lava was opened on 26 March 2026. NOAA is redeveloping the site, with a new sampling tower, a renovated Keeling Building, more laboratory space and solar power so the observatory can keep running if the grid is cut again.
Watching the number
The number in the corner updates each month. If the net-zero goal were achieved, number would eventually stop increasing. Most of the world's governments are now scaling back or abandoning their net-zero targets.
The burning of fossil fuels increases CO₂ in the atmosphere. The amount of CO₂ in our atmosphere is growing faster than at any time in human history. It is increasing at a rate that is at least 10 times faster than any other period we know of. It is the one number that represents the modern age.