A lament for ice rivers
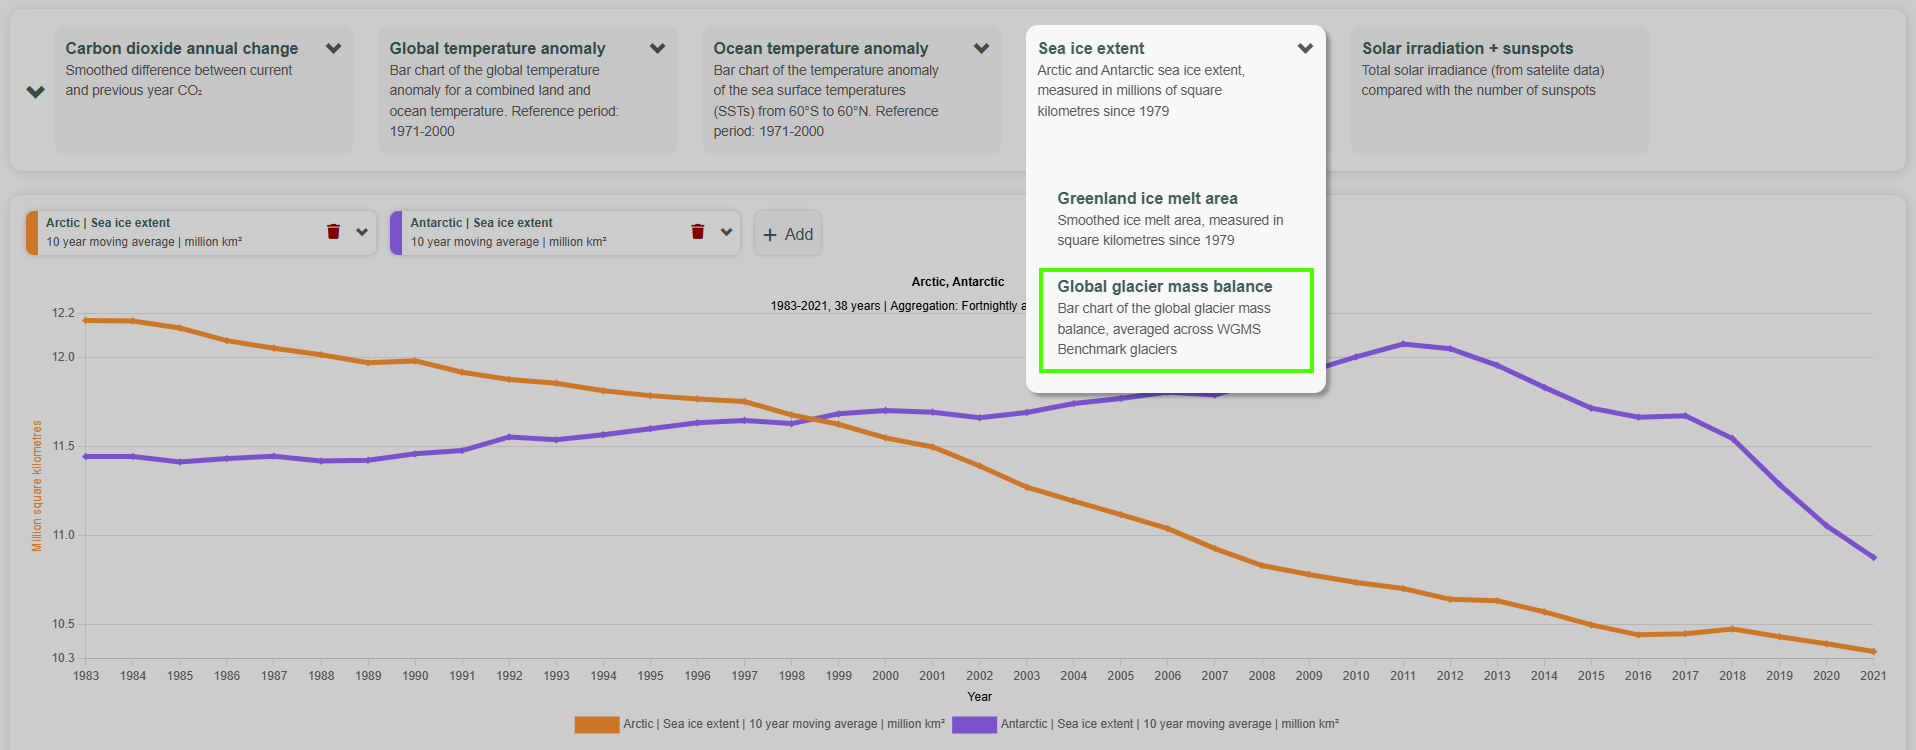
ClimateExplorer has a new global preset: Global glacier mass balance, sourced from the World Glacier Monitoring Service (WGMS). Glaciers are one of the clearest indicators of a warming world. The new preset is on the global page, grouped with the other cryosphere indicators like sea ice extent and Greenland ice melt area.
What the dataset measures
WGMS coordinates glaciological field measurements from research groups all over the world, publishing them in its Fluctuations of Glaciers database. Each contributing glacier reports an annual mass balance — in effect, how many metres of water the glacier gained or lost over the year, averaged across its surface. A negative number means the glacier lost more ice (as meltwater) than it gained (as new snow and ice).
Turning several hundred individual glacier records into one global figure takes a couple of judgement calls. We've taken WGMS's general approach for its published reference-glacier index:
- Which glaciers count. Only WGMS "Benchmark" glaciers contribute — those with more than 10 years of ongoing measurements. A glacier that has only been measured for a couple of years isn't yet a reliable long-term record, so it's left out. Using this approach, all of the WGMS reference glaciers (> 30 years of records) are also included.
- How they're combined. Rather than one flat average of every qualifying glacier, each year's values are averaged in two stages: first within each glacier's region (so, all the European Alps glaciers together, all the Andean glaciers together, and so on), and then those regional averages are averaged into a single global figure. This stops a densely-instrumented region like the Alps — which has far more monitored glaciers than most of the world — from dominating the global number just because more people happen to measure glaciers there.
Here's the description as it appears in the app:
A global glacier mass balance index (in metres water equivalent), built from the World Glacier Monitoring Service's Fluctuations of Glaciers database. Includes every 'Benchmark' glacier - more than 10 years of ongoing glaciological mass-balance measurements. Each year's raw annual balance is averaged within each glacier's region first, then across regions, so no single densely-instrumented region (e.g. the Alps) dominates the global figure - the same two-stage approach WGMS uses for its own published reference-glacier figures.
The record runs from 1946 to the present, and the trend is unambiguous: almost every year since the 1980s has been a year of net loss.
Adding it up: a new Cumulative calculation
A year-by-year mass balance chart shows the annual signal clearly, but it doesn't answer the question: how much ice has been lost, in total, since records began? To answer that there is a new calculation option: Cumulative. Instead of plotting each year's value on its own, it plots a running total — each year's balance added to the sum of every year before it.
Apply it to the glacier mass balance series and you get a single descending line: the accumulated loss since 1946.
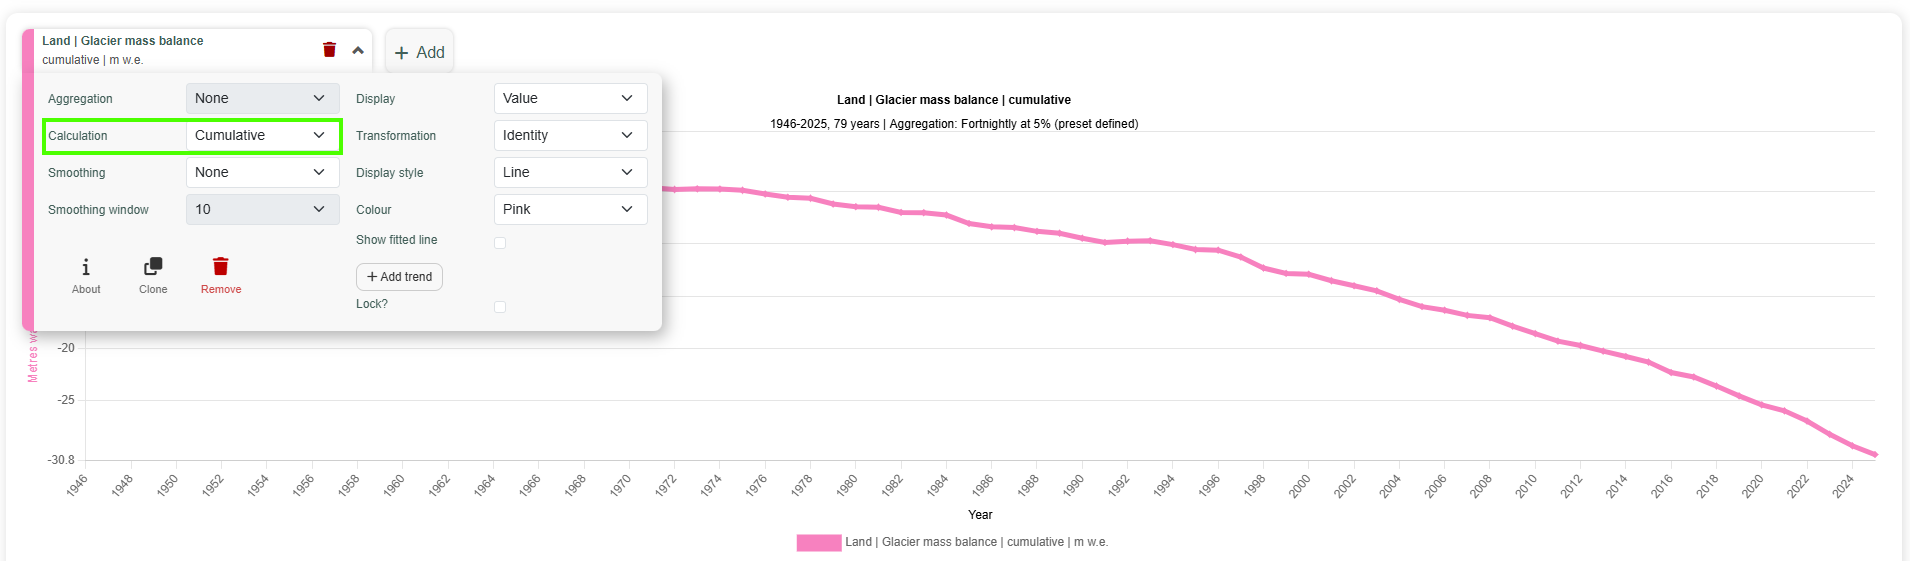
By the most recent year in the record, the world's Benchmark glaciers have lost the equivalent of around 30 metres of water, averaged over their combined surface area. "Metres water equivalent" is the standard unit glaciologists use for mass balance. That is not the depth of ice (ice is less dense than water - a given mass of ice occupies more volume), it's the depth of liquid water when melted. Thirty metres of water an enormous amount of ice to have disappeared in three-quarters of a century.
The ones near us
Almost all of the glaciers in the WGMS record — the ones in the European Alps, the Himalayas, the Andes, Alaska, the Rockies, the Caucasus — are the glaciers people live near, depend on for meltwater, and grew up looking at. Those are the glaciers this dataset is about. Many have already shrunk to a fraction of their 19th-century extent. Some have vanished outright. On current trends, most of what's left in these ranges will be drastically smaller by the middle of this century, and largely gone by 2100.
About 99% of the planet's glaciers sit in the Antarctic and Greenland ice sheets, not in the mountain ranges mentioned above. Greenland's ice is thick and cold enough that even sustained warming plays out over millennia, not decades.
On 26 August 2026, a slab of ice and rock roughly 0.2 km² broke away from Langtang Lirung, high above Nepal's Rasuwa district, and fell over a kilometre into the valley below. The impact triggered a cascading landslide, river-blockage, and flood down the Trishuli River, wiping out the Gyirong border checkpoint and settlements along more than 70 kilometres of the valley on both the Nepali and Chinese sides. As of this writing, more than 1000 people are confirmed dead in Nepal alone, with thousands more missing.
Until these glaciers melt away, events like this will occur again. When they're gone, earthquakes will happen for centuries as the land rises after the weight is lifted. The lives of the people who live near glaciers will change fundamentally as their climate changes.