Location summary information
When you use ClimateExplorer, you may see info boxes that explain a few of the climate-related concepts presented in the web application. In the location summary area, they are:
- Warming index
- Heating score
- Climate stripe
We thought it might be a good idea to present the text on the blog, as a summary of some of the concepts. Below is what you may see as pop-up text if you click on the corresponding area in the application.
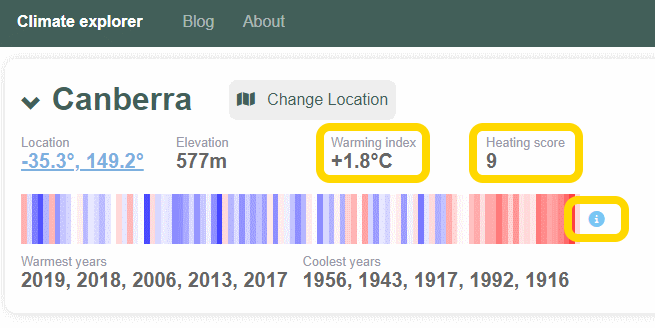
Warming index
The warming index is the temperature difference between the average of the last 20 years of maximum temperatures compared with the average of the first half (50 years) of the dataset.
Canberra, between the years 2001-2020, had an average max temp of 21.06°C.
Canberra, between the years 1914-1970, had an average max temp of 19.29°C.
The difference is +1.8°C (after rounding to 1 decimal place).
Over the long-term, with no external influences, we’d expect the warming index to trend towards zero. A non-zero warming index may indicate an effect of climate change. A positive warming index may indicate global warming.
Heating score
The heating score is a number typically between 0 and 9. It is derived from comparing all warming indexes across the locations in the dataset. The highest warming index is used to standardise the values.
To calculate the heating score:
- For warming indexes that are greater than zero, divide the warming index by the maximum warming index in the set, multiple by 9 and round to zero decimal places.
- For warming indexes that are less than zero, the only operation done is to round the number to zero demical places.
The score may be higher if:
- The location is inland. The ocean is warming more slowly compared with the land. Coastal locations are therefore likely to have warmed less than inland locations.
- The station(s) has been operating for a long time. The effect of global warming is more obvious with a large dataset as temperatures in the past were cooler.
Climate stripe
Climate stripes are a simplified bar chart of average temperatures, ordered by year, from the earliest year in the record until the most recent. Each coloured stripe represents a single year of temperature data. A blue stripe is a year where the temperature is below the average of the whole series. A red stripe represents an above average temperature.
Climate stripe colours are calculated by the following algorithm.
-
Calculate the average temperature for the whole series (e.g., Canberra 1914-2020 mean is 19.8°C)
-
For each year in the series, subtract the average temperature for the year from the average for the series. Note:
- This value in step 2 is often called the temperature anomaly
- If the anomaly is above 0°C, we consider it a warmer than average year
- If the anomaly is below 0°C, we consider it a colder than average year
-
Find the coldest anomaly (e.g., Canberra’s is -2°C) and assign it the strongest colour of blue
-
Find the warmest anomaly (e.g., Canberra’s is 2.9°C) and assign it the strongest colour of red
-
All anomalies between the extremes are lighter shades of blue or red
Climate Explorer’s stripe is interactive. Hover over any year in the series then click. The chart will update with a monthly view of the selected year.